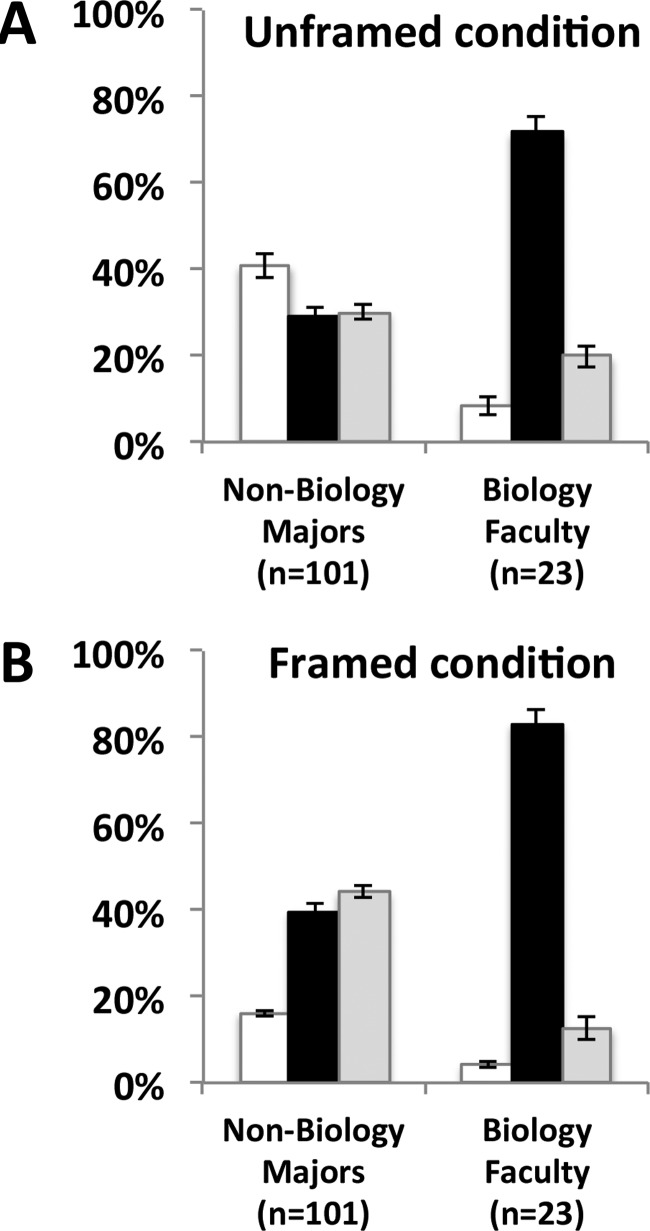
Figure 4.
Average percentages of surface feature, deep feature, and unexpected card pairs. Average percentages of surface feature card pairs (white bars), deep feature card pairs (black bars), and unexpected card pairs (gray bars) generated in the unframed task condition (A) and the framed task condition (B) are shown for non–biology majors (left) and biology faculty (right). Comparison between non–biology majors and biology faculty showed that they construct significantly different proportions of each type of card pair compared with one another in both the unframed and framed task conditions (p < 0.001 or lower for each type of card pair). Additionally, non–biology majors constructed a significantly different proportion of each type of card pair in the framed task condition as compared with their results in the unframed condition (p = 0.0006 or lower for each type of card pair), whereas biology faculty only constructed a significantly different proportion of deep feature card pairs in the framed task condition as compared with their results in the unframed condition (p < 0.03). See Results for statistical details.

