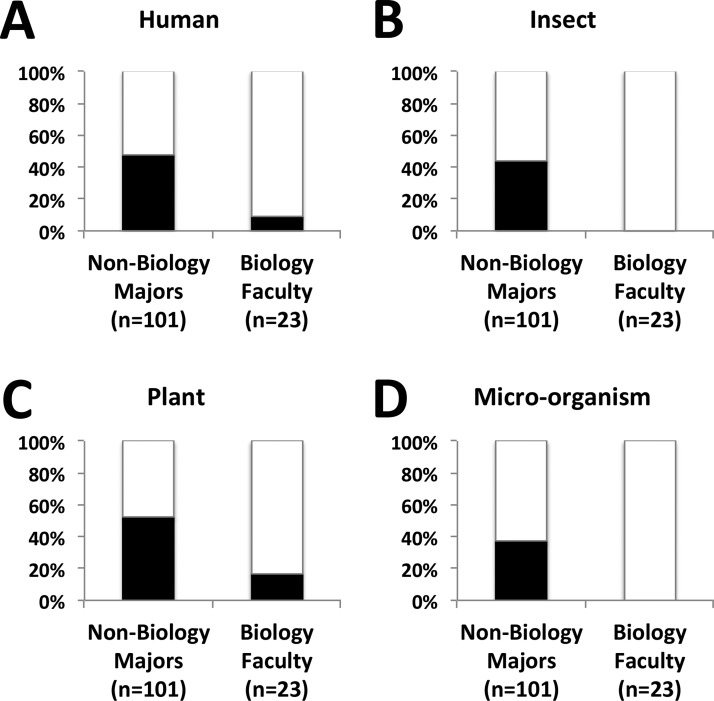
Figure 7.
Prevalence of surface features in card group names in the unframed task condition. Proportions of participants who included (black bars) or did not include (white bars) each surface feature in one or more of their card group names in the unframed task condition are shown for non–biology majors (left) and biology faculty (right) for each of the hypothesized surface features: (A) “Human,” (B) “Insect,” (C) “Plant,” and (D) “Microorganism.” A significantly larger proportion of non–biology majors included each surface feature in their card group names as compared with biology faculty (p < 0.003 or lower for each surface feature). See Results for analysis rubric and statistical details.

