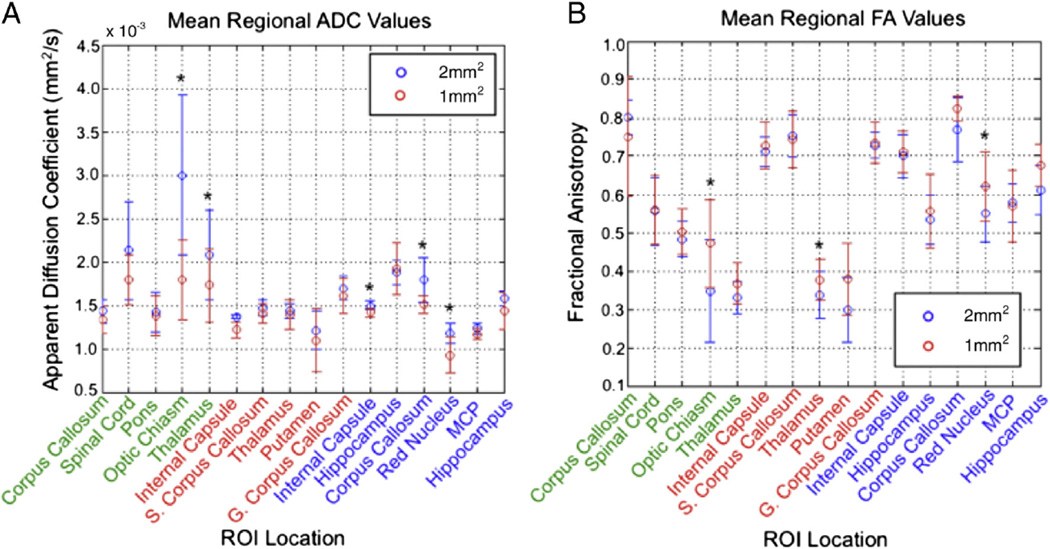
Fig. 7.
Measured ADC (A) and FA (B) values in the three targeted planes through the midbrain for various ROIs selected. Features with green text correspond to the sagittal orientation; red, the transverse; and blue, coronal. Average values are displayed for both 2- and 1-mm2 resolutions. Those ROIs with significant difference between resolution are indicated with asterisk (*).

