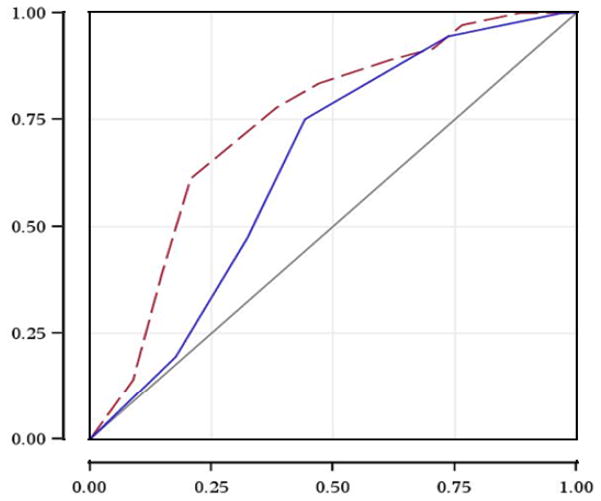
Figure 2.
ROC curve for 2-year overall mortality: IPI and IPI + EBV status
X-axis: 1-Specificity
Y-axis: Sensitivity
Solid line: International Prognostic Index only (area under the ROC curve: 0.65)
Dash line: International Prognostic Index + tumor EBV infection status (area under the ROC curve: 0.74)

