
Fig. 4.
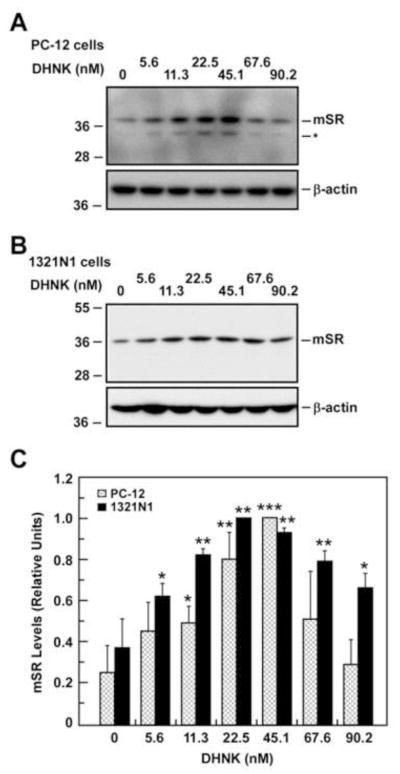
Expression of m-SR protein after treatment with different concentrations of (R,S)-dehydronorketamine (DHNK) for 36 h. Western blot analysis in PC-12 cells (A) and 1321N1 cells (B) with anti-SR antibody shows the expression of m-SR. C, Relative levels of m-SR in both PC-12 and 1321N1 cells after quantification and normalization with β-actin are shown in bars. Data represents the average ± SD of three independent experiments. *, ** and ***, P< 0.05, 0.01 and 0.001 as compared with the control cells.