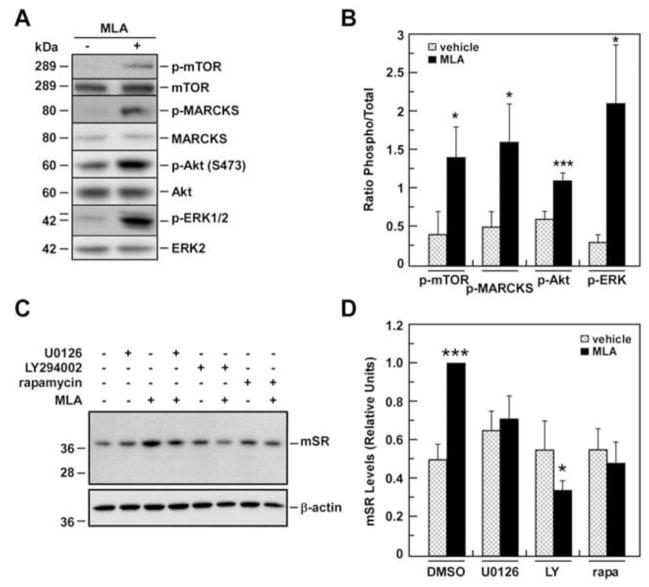
Fig. 6. Effects of pharmacological inhibitors on SR expression in basal and MLA-treated 1321N1 cells.
A, 1321N1 cells were treated with MLA for 1 h and processed for Western blot analysis. Signals associated with phosphorylated active and total forms of mTOR, MARCKS, AKT and Erk1/2 are shown. B, Bars represent the ratio of phosphorylated versus total forms after quantification. C, m-SR protein levels were determined after a 12-h treatment either with U0126 (UO), LY294002 (LY) or rapamycin (rapa) with or without addition of MLA. β-actin was used as a loading control. D, Relative m-SR levels after quantification and normalization with β-actin are shown in bars. Data represents the average ± SD of three independent experiments. * and ***, P< 0.05 and 0.001 as compared with the control cells.

