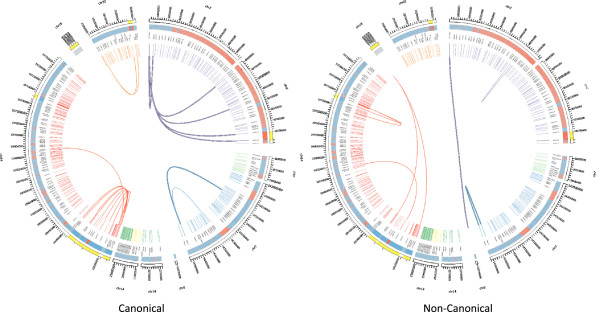
Figure 6.

Observed V(D)J recombination events. Chromosome positions are shown in the outermost curved segments, one segment per contiguous genomic interval. Alignability is represented by red and blue tiles directly within, blue for regions that are > = 80% alignable and red for regions that are < 80% alignable, given 100 bp reads. Colored slashes composing the innermost ring represent VDJ segments. Different colors represent different loci, with the name of the locus and the segment appearing between the slashes and the curved segments. Line segments within the circle represent observed recombinations of VDJ elements or VDJ elements with non-VDJ sequence as with the chromosome translocations. The highlighted sections are areas over which the scale has been changed to better distinguish the recombination events. Taller segments with black borderlines represent inversions.
