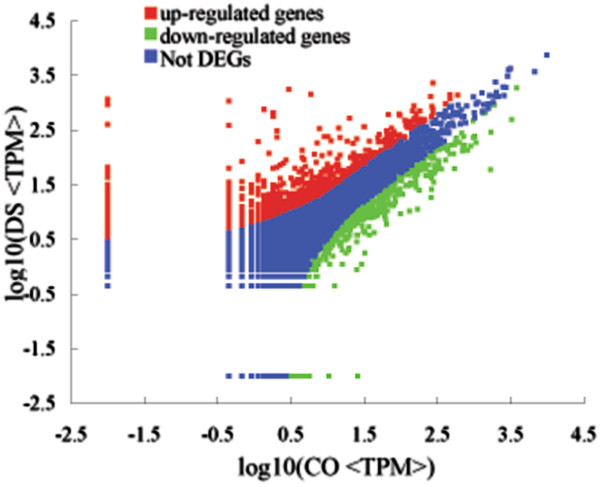
Figure 3.

Comparision of gene expression level between CO and DS libraries. Red dots represent transcripts more prevalent in the DS library, green dots show those present at a lower frequency in the drought stress ramie and blue dots indicate transcripts that did not change significantly. The parameters “FDR ≤ 0.001” and “log2 Ratio ≥ 1” were used as the threshold to judge the significance of gene expression difference.
