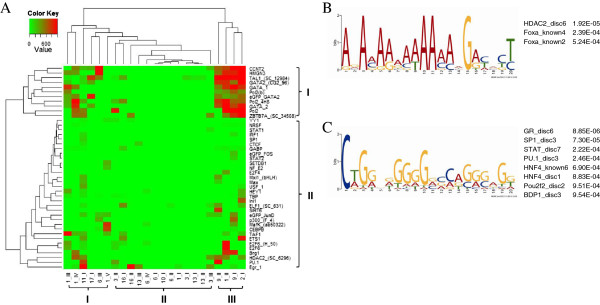
Figure 6.

Bioinformatic analyses of erythroid-specific KLF enhancers. (A) Heat map of TFs binding to the 23 DHSs in K562 cells from ChIP-seq data after hierarchical clustering. (B-C) Motifs discovered from erythroid-specific KLF enhancers using MEME. The matched motifs with p-values < 0.001 are listed below corresponding figures.
