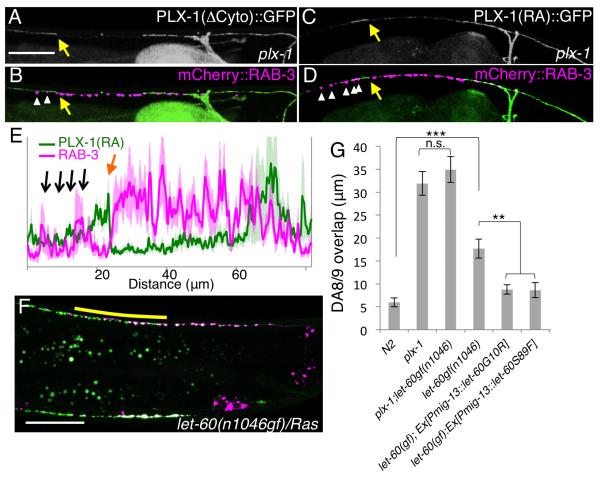
Figure 6. PLX-1 tiles synapses by inactivating Ras in DA9.
(A-D) Subcellular localization of PLX-1 lacking its cytoplasmic domain (ΔCyto) (A and B) and RasGAP-deficient PLX-1 (PLX-1(RA)::GFP) in the plx-1 mutants (C and D). PLX-1 signal at the putative tiling border is indicated by yellow arrows, and ectopic synapses (mCherry::RAB-3) in the anterior axon are indicated by white arrowheads in (Band D). (E) Quantification of the normalized mCherry::RAB-3signal (magenta) and PLX-1(RA)::GFP signal (green) in the dorsal axon of wildtype worms. 18 animals were aligned according to the PLX-1::GFP patch at the putative anterior edge of the DA9 synaptic domain (orange arrow). Black arrows indicate ectopic RAB-3 signal anterior to the PLX-1(RA) localization. The light-green and light-magenta traces indicate standard error of mean. Scale Bars, 20 μm. (F) Synaptic tiling defect in let-60 (Ras) gain-of-function mutants. Yellow bar indicates DA8/DA9 synaptic overlap. (G) Genetic interaction between plx-1 and let-60(gf), and cell-specific suppression of let-60(gf) by two dominant negative LET-60 mutants. Triple asterisks; p<0.001, Double asterisks; p<0.01, n.s.: not significant (ANOVA/Tukey-HSD). Scale bar, 20μm.

