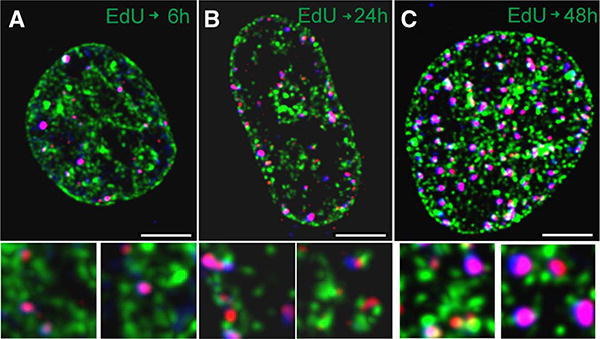
Figure 5.

Confocal images (central slices) of nuclei of cells exposed to 10 μM EdU for 1 h and then grown in absence of EdU for 6 h (A), 24 h (B), or 48 h (C). The images show the incorporated EdU (green), γH2AX (red), and 53BP1 (blue). Thus, the foci containing both γH2AX (red) and 53BP1 (AF633, for convenience represented by in blue) appear purple. The size marker is 5 μm. The bottom panels (field of view 3 3 3 μm each) show the γH2AX and/or p53BP1 foci that colocalize and are in close proximity to sites of EdU incorporation, selected from the respective cell images (enlarged).
