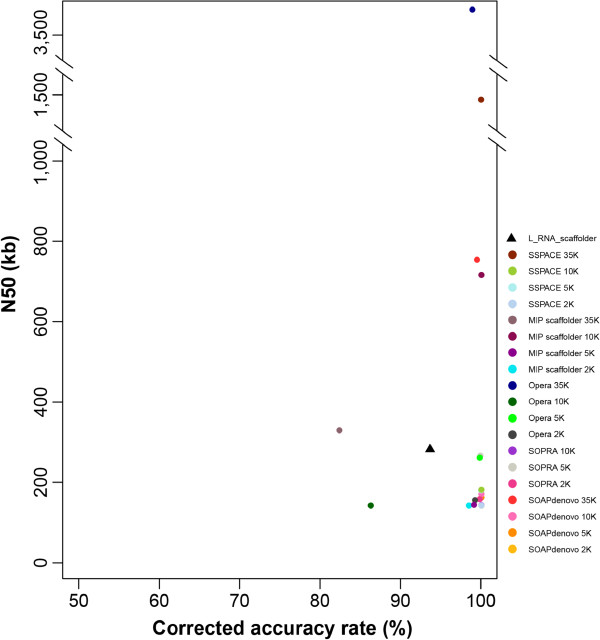
Figure 4.
Corrected accuracy rates versus scaffold N50 values. The corrected accuracy rate is measured as the proportion of consistent connections and correctable relocations. N50 values represent the size N at which 50% of the genome is contained in scaffolds of length N or larger. The triangle represents the corrected accuracy rate and the N50 value of L_RNA_scaffolder.

