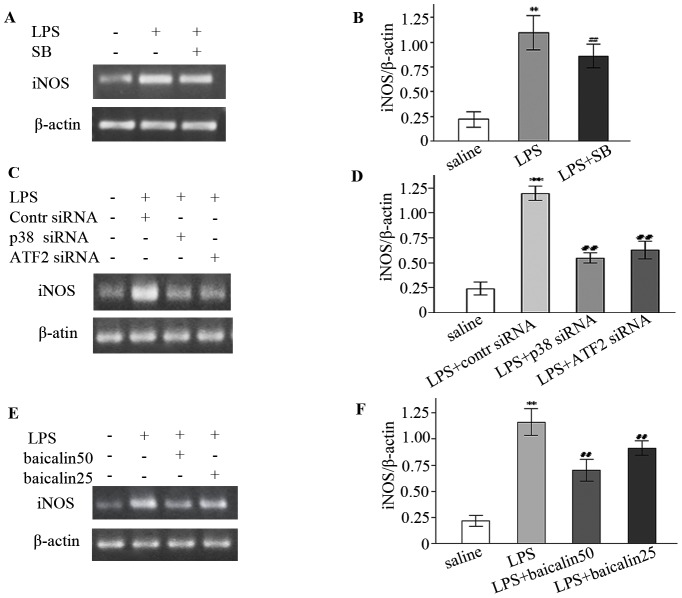
Figure 2. LPS increased but SB202190 (SB), siRNA and baicalin decreased iNOS mRNA expression.
A, C, E: Representative gels for iNOS mRNA expression. β-actin is the internal control. B, D, F: Semiquantitation of iNOS mRNA in each group. * P<0.05, ** P<0.01 vs. saline group; # P<0.05, ## P<0.01 vs. LPS group or LPS plus control (contr) siRNA group.

