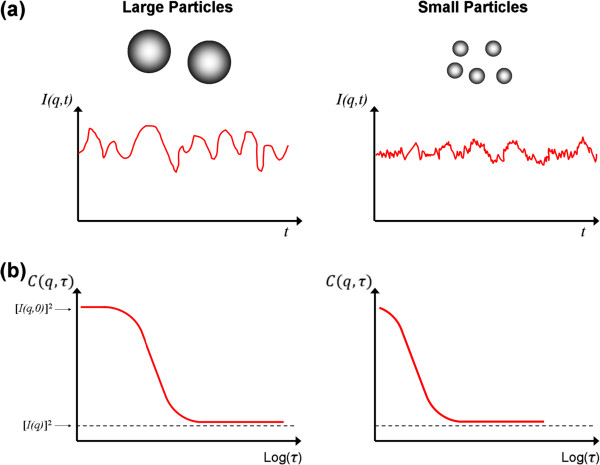
Figure 2.
Schematic illustration of intensity measurement and the corresponding autocorrelation function in dynamic light scattering. The figure illustrates dispersion composed of large and small particles. (a) Intensity fluctuation of scattered light with time, and (b) the variation of autocorrelation function with delay time.

