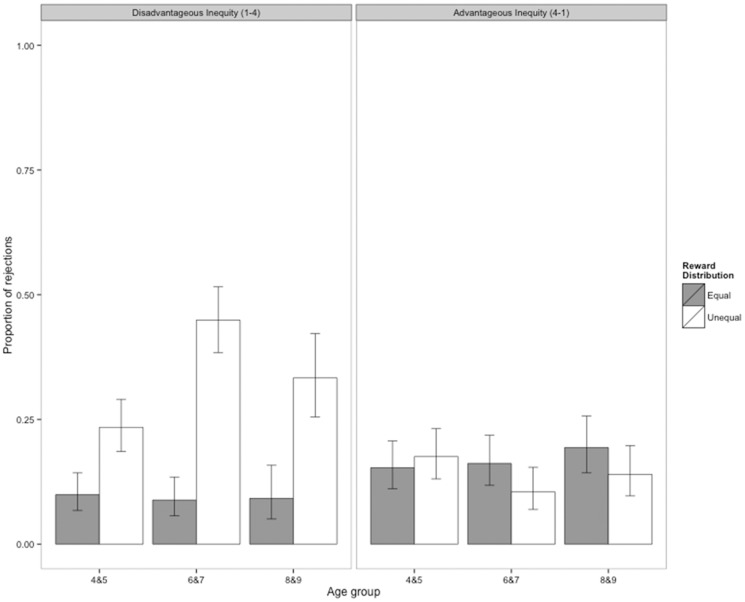
Figure 3. Proportion of reward allocations rejected in Experiment 2, the nonsocial version of the Inequity Game.
Rejections are shown for the disadvantageous inequity condition (A) and the advantageous inequity condition (B). Participants were assigned either to the disadvantageous inequity condition (N = 98) or to the advantageous inequity condition (N = 103). In the disadvantageous inequity condition, participants received one piece of candy while either one piece (equal distribution) or four pieces (unequal distribution) were placed on the other side of the apparatus. In the advantageous inequity condition, participants received either one piece of candy (equal distribution) or four pieces (unequal distribution) while one piece was placed on the other side of the apparatus. In both the disadvantageous inequity and advantageous inequity conditions, participants received six equal and six unequal trials. Error bars represent 95% confidence intervals.

