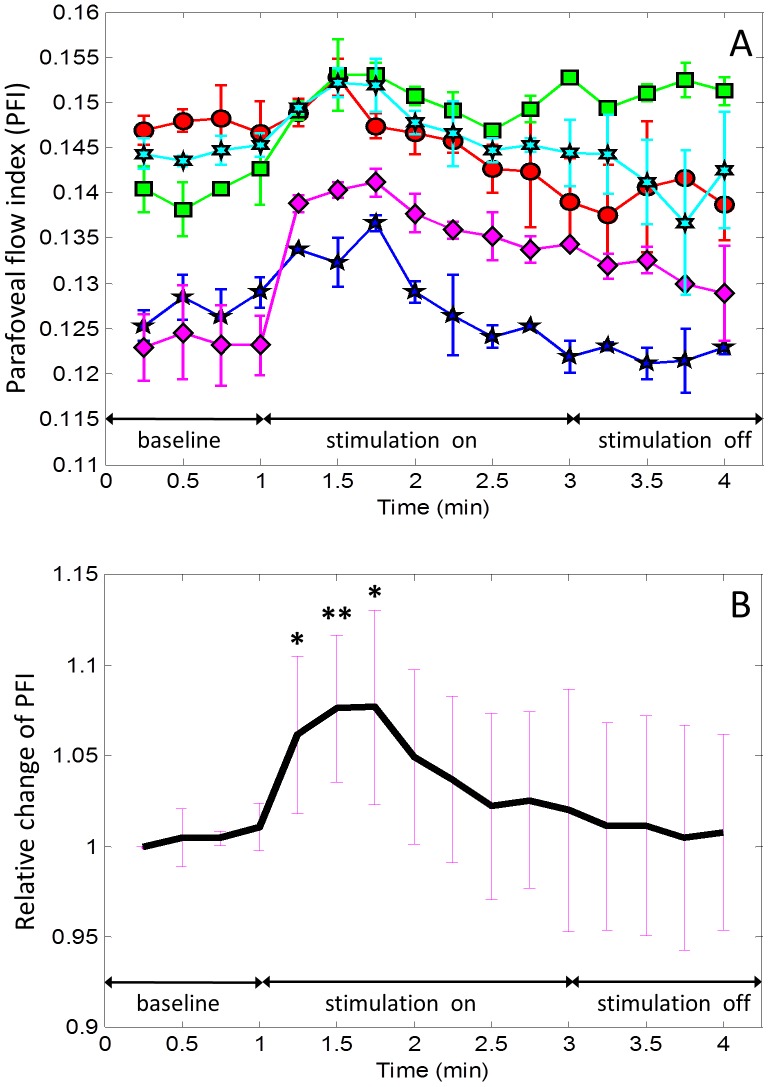
Figure 5. Time course of parafoveal flow index (PFI) with stimulation turned on and then off.
(A) Plot for individual subjects averaged from two experimental sequences. (B) Relative change from baseline averaged over all subjects. Two tailed paired t-tests with Bonferroni correction were used. * = P<.0042; ** = P<.001. The symmetric error bars in both (A) and (B) represent two standard deviation units in length.

