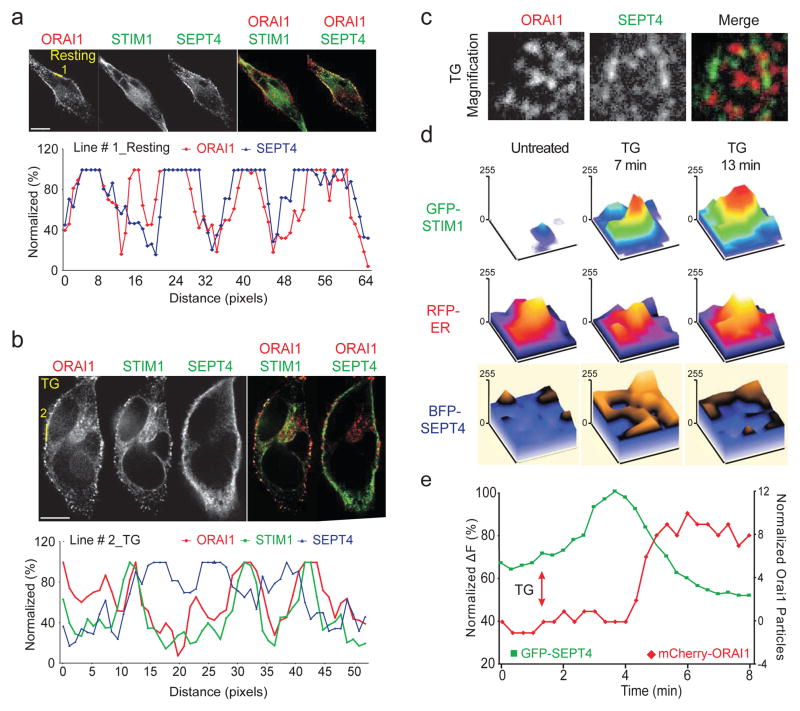
Figure 3. Septin 4 relocalises at the plasma membrane after ER Ca2+ store depletion.
a and b, (Upper) Single-channel and merged confocal images of HeLa cells expressing mCherry-ORAI1, GFP-STIM1 and FLAG-SEPT4, unstimulated (a) or stimulated for 10 min with TG (b). (Lower) Normalised pixel intensities along the indicated line scans. c, Single-channel and merged TIRFM images of HeLa cells expressing mCherry-ORAI1, STIM1 (not shown) and GFP-SEPT4 after 10 min of TG stimulation. d, Surface plots of pixel intensities from TIRFM images of HeLa cells expressing GFP-STIM1, RFP-ER and BFP-SEPT4, before and after stimulation with TG in 0 mM [Ca2+]o. e, Kinetics of GFP-SEPT4 fluorescence (green trace) and mCherry-ORAI1 particle number (red trace) at the TIRF layer in a typical cell. A time series of images of this cell is shown in Supplementary Figure 6b.

