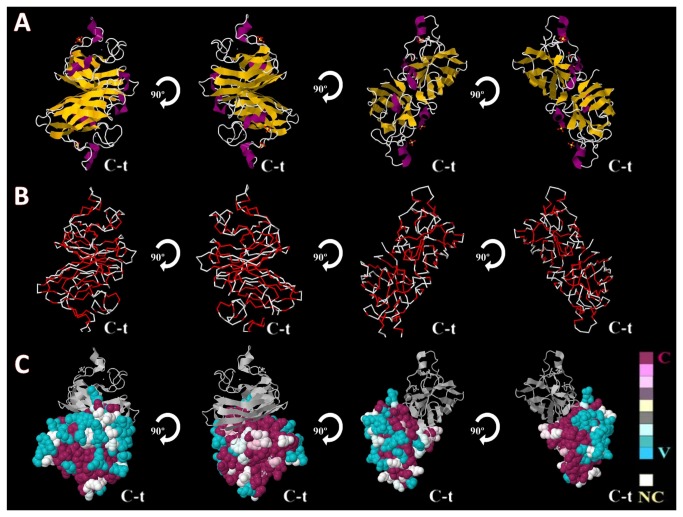
Figure 3. Structural conformation and conservational analysis of the human SOD1.
(A) Structural representation of the three-dimensional model of the SOD1 [PDB: 2VOA] in a form of a diagram in cartoon. Different elements of the secondary structure are in various colors: in magenta, the alpha helix; in yellow arrows, beta sheets; and in white lines, coils. (B) Three-dimensional structure of human SOD1, represented in backbone form of, with mutations described on the literature marked in red. (C) Conservation profile of human SOD1 using ConSurf conservation analysis. The protein was visualized using Jmol with color-coded conservations. The conserved and variable residues are presented as space-filled models and colored according to the conservation scores. Each structure is turned 90 degrees to show the different sides of the protein.

