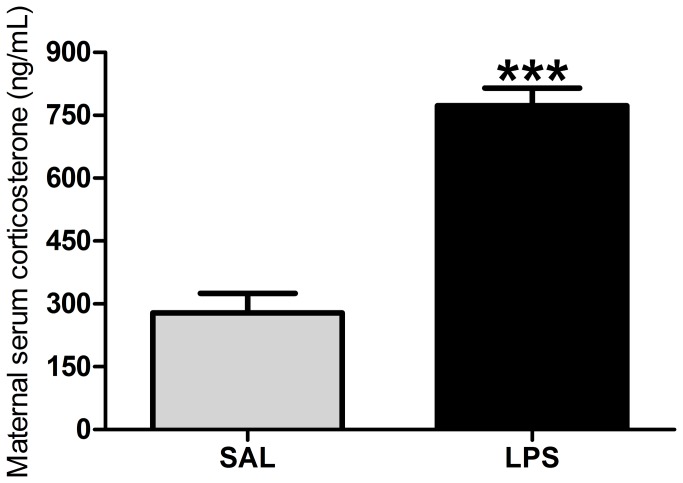
Figure 1. Maternal serum corticosterone levels.
Effects of LPS exposure (100 µg/kg on GD 9.5) on serum corticosterone levels in pregnant rats 90 minutes after the administration of LPS. Gray bar = control (SAL) group (n = 8); black bar = LPS group (n = 9). ***p < 0.0001 (Student’s t-test) compared with the SAL group. The values are given as the mean ± SEM.

