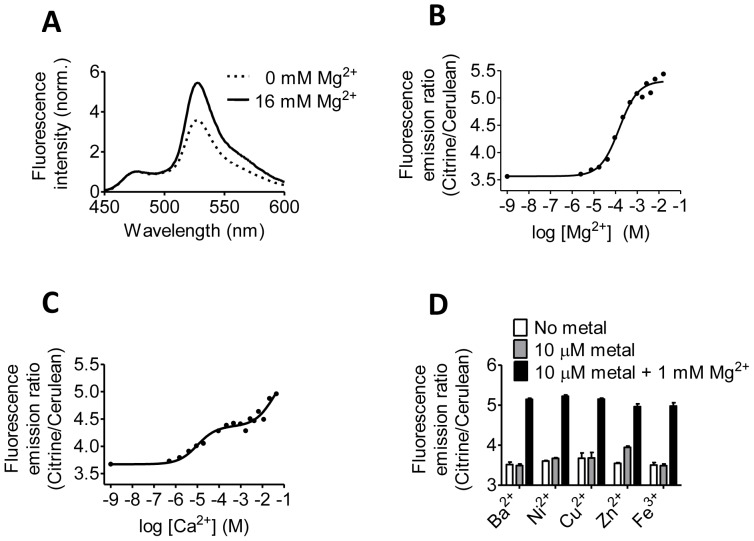
Figure 2. Metal binding properties of MagFRET-1.
(A) Normalized fluorescence emission spectra of MagFRET-1 at 0 and at 16 mM Mg2+ after excitation at 420 nm. (B, C) Emission ratio (Citrine to Cerulean) of MagFRET-1 as a function of the Mg2+ (B) or Ca2+ (C) concentration. Solid lines indicate a fit to a single (B) or a double (C) binding event, yielding a K d of 0.15±0.02 mM for Mg2+ and K d's of 10±4 µM and ∼35 mM for Ca2+, respectively. (D) Emission ratios of MagFRET-1 in absence of metal, in the presence of 10 µM Ba2+, Ni2+, Cu2+, Zn2+ or Fe3+, and in the presence of the same metals and 1 mM Mg2+. Measurements were performed in triplicate, error bars indicate SEM. All measurements were performed in 150 mM Hepes (pH 7.1), 100 mM NaCl and 10% (v/v) glycerol with 0.2 µM sensor protein.

