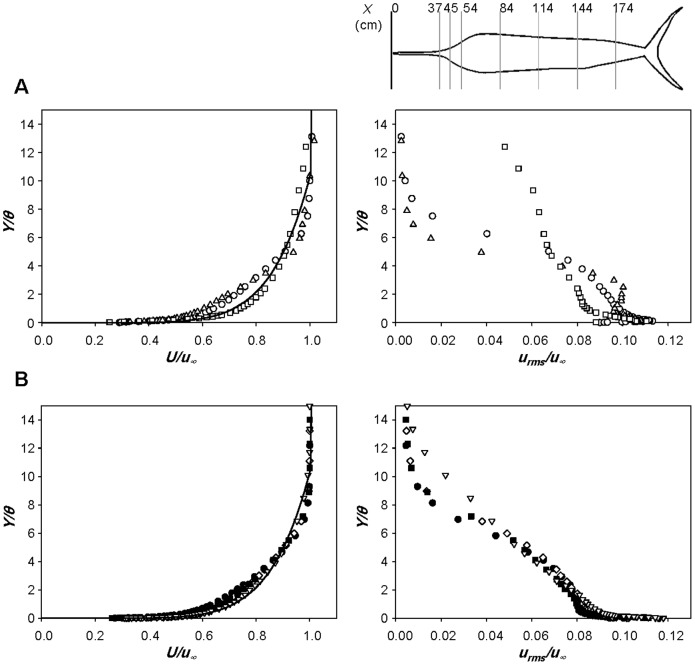
Figure 5. Velocity profiles over the body surface of the sailfish.
Profiles of the mean streamwise velocity (left) and rms streamwise velocity fluctuations (right) at the anterior A, middle and posterior B parts of the sailfish: ○, X/TL = 0.164 (37 cm; ReX = 4.93×10⁵); △, 0.200 (45 cm; ReX = 6.00×10⁵); □, 0.240 (54 cm; ReX = 7.20×10⁵); •, 0.373 (84 cm; ReX = 1.12×10⁶); ⋄, 0.507 (114 cm; ReX = 1.52×10⁶); ▪, 0.640 (144 cm; ReX = 1.92×10⁶); ▽, 0.773 (174 cm; ReX = 2.32×10⁶). –, turbulent boundary layer profile (1/7th power law) [45]. Here, X is the streamwise distance from the tip of bill, Y is the wall-normal distance from the body surface and θ is the momentum thickness (Table 2). The velocities are measured along the centerline of side surface of the sailfish at ReTL = 3.0×10⁶. Shown at the top are the measurement locations in the streamwise direction.

