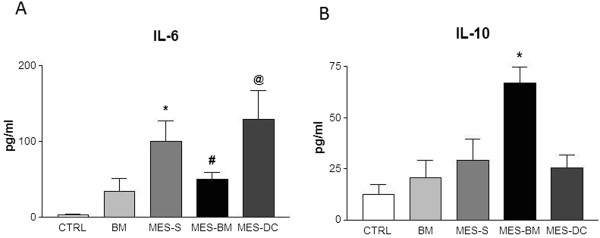
Figure 4.

Histograms depicting the blood levels of IL-6 (A) and IL-10 (B) of naïve CTRL medium- and BM-injected animals and, MES-S, MES-BM and MES-DC animals. ANOVA one-way followed by Tukey’s multiple comparison test indicates significant differences (in A *p < 0.05 versus CTRL and BM; #p < 0.05 versus MES-DC; @p < 0.05 versus CTRL, BM and MES-BM groups; in B *p < 0.01 versus the four groups). Data represent means ± SEM.
