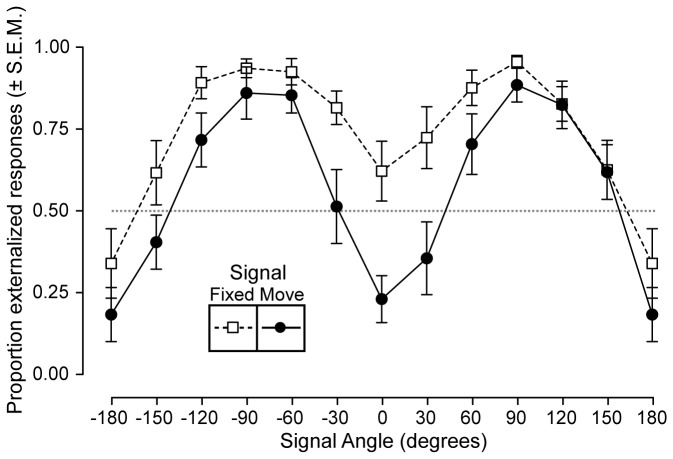
Figure 3. Free-field externalization results (fullband signals).
The degree of externalization is plotted as a function of signal direction. The data from the signal fixed condition is plotted as open circles with dashed lines and the data from the signal moving condition is plotted as filled circles with solid lines. Note that the data points at +180° and -180° are duplicates of one another. Signals that move with the head are less likely to be externalized than those that remain fixed with respect to a particular loudspeaker, especially for signals located directly in front and behind the listener.

