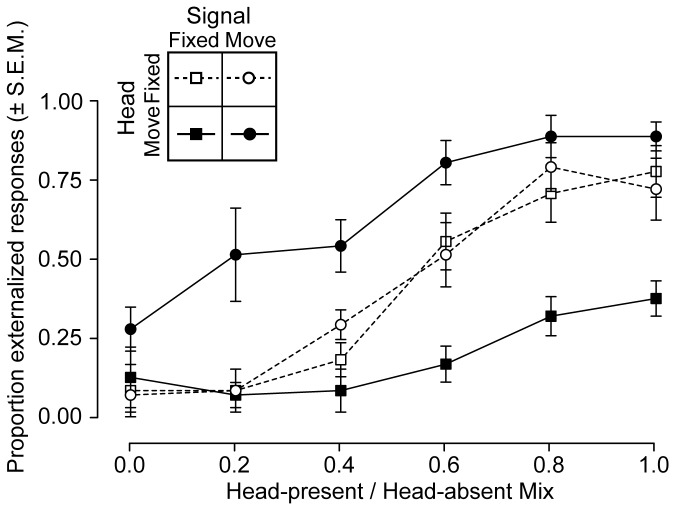
Figure 6. Virtual acoustics externalization results.
The degree of externalization is plotted as a function of head-present / head-absent mix, varying from all head-absent (0.0) to all head-present (1.0). Head fixed conditions are plotted as dotted lines and open symbols, head moving conditions are plotted as solid lines and filled symbols. Signal fixed trials are plotted as squares and signal moving trials are plotted as circles.

