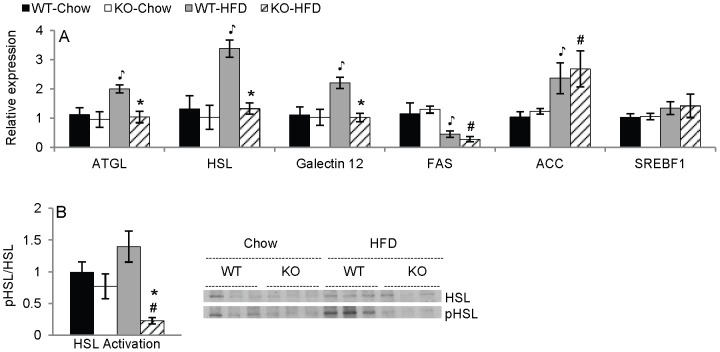
Figure 3. Expression of markers of lipolysis in VAT.
Panel A: Expression of ATGL, HSL, and Galectin-12 mRNA in fasted mice and FAS, ACC, and SREBF1 mRNA in fed mice in VAT (n = 5). Panel B: Ratio of pHSL to HSL protein in fasted mice in VAT by western blot (n = 3). *p<.05 vs. respective diet-matched WT group,  p<.05 vs. WT-Chow, #p<.05 vs. KO-Chow. Data are mean ± SEM.

