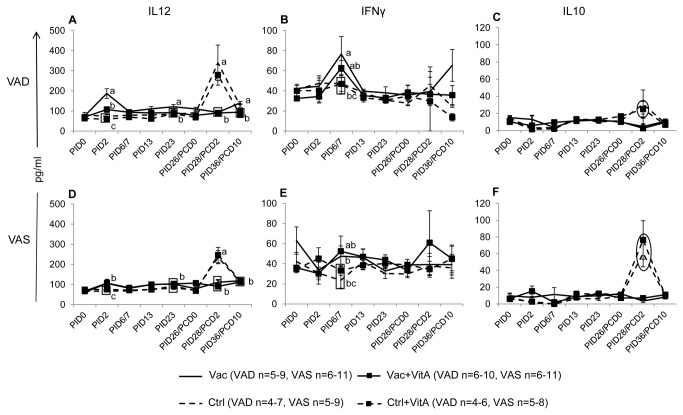
Figure 6. Vitamin A deficiency induced pro-inflammatory immune responses.
Mean concentrations (± SEM) of IL12 (A,D; Th1), IFNγ (B,E; Th1) and IL10 (C,F; anti-inflammatory) cytokines in serum of vitamin A deficient (VAD) and sufficient (VAS) pigs vaccinated with AttHRV vaccine or placebo with or without vitamin A supplementation. Data shown as mean values ± standard error of the mean. Different lower-case letters indicate statistically significant difference (non-parametric Kruskal-wallis rank sum test, p ≤ 0.05) among the treatment groups belonging to VAD and VAS pigs at the same time-point for each cytokine. The circles (C,F) indicate 2-3 fold higher IL10 in VAS control groups compared to VAD control groups. Vac = 3X AttHRV vaccinated only, Vac+VitA = 3X AttHRV vaccinated + 100,000 IU of vitamin A, Ctrl = non-vaccinated and non-vitamin A supplemented, Ctrl+VitA = 3X 100,000 IU of vitamin A only.

