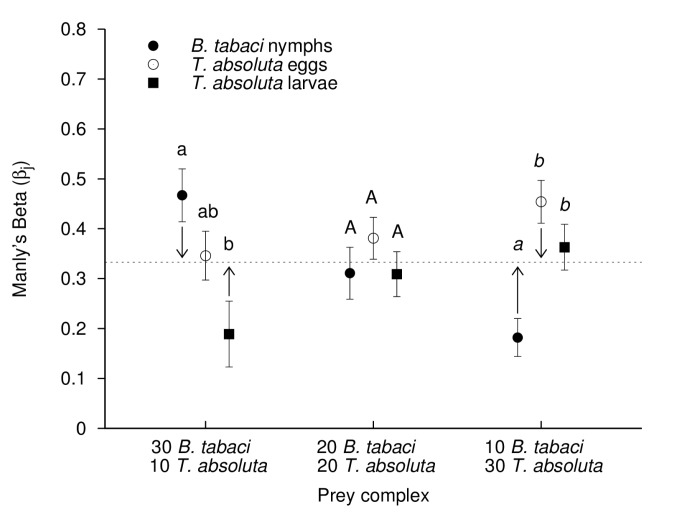
Figure 3. Prey preference of M. pygmaeus adult predators (based on Manly’s Beta values) depending on initial ratio among prey.
Manly’s Beta values (± SE) for M. pygmaeus adult predators in three-prey patches (B. tabaci nymphs, T. absoluta eggs and T. absoluta larvae) with various B. tabaci – T. absoluta prey ratios (Prey complex). Dotted line represents the expected βj value against which calculated βj values for each prey are compared (Student’s t-test, significance difference with expected βj values are indicated by arrows, at the 0.05 level). Different letters for a given B. tabaci – T. absoluta prey ratio indicate significantly different βj values between the three prey types (P > 0.05, ANOVA with Tukey’s post-hoc analysis).

