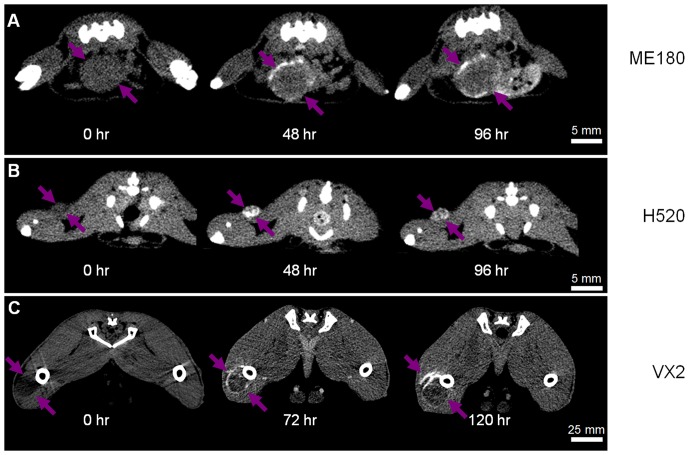
Figure 2. Micro-CT images of CT-liposome accumulation.
Representative images of CT-Liposome accumulation are shown for an ME180 mouse orthotopic tumor (a), an H520 mouse subcutaneous tumor (b), and a VX2 rabbit intramuscular tumor (c). The arrows indicate the extent of the tumor volume. The transverse images illustrate the intra-tumoral heterogeneity of liposome accumulation; particularly in the ME180 and VX2 tumors which have predominantly peripheral liposome accumulation. Note the difference in scales.

