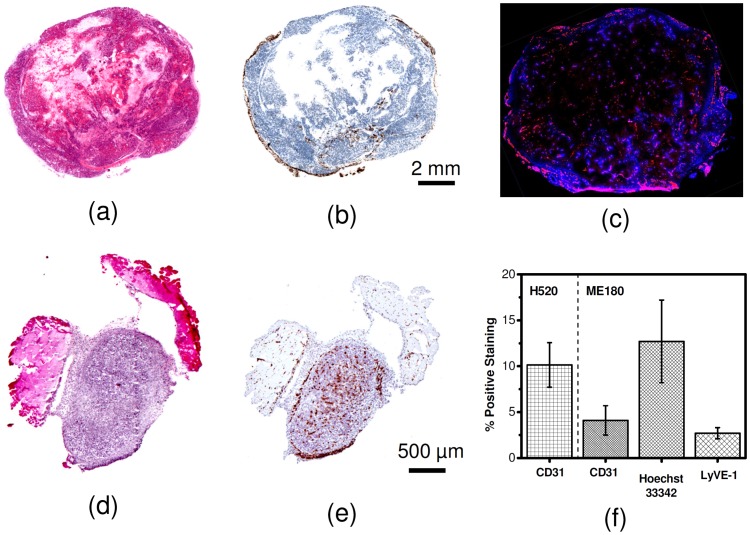
Figure 5. Representative histology sections for H520 and ME180 tumor tissue.
(a) H&E and (b) LYVE1 sections for ME180 tumors showing patches of necrosis, and predominantly peripheral lymphatic vessels. (c) A representative section showing heterogeneous perfusion (blue) and blood vessels distribution (red) in an ME180 tumor. (d) H&E and (e) CD31 sections for H520 tumors showing no necrosis and a largely homogeneously vascularized tumor. (f) Quantitative analysis demonstrating average percent positive staining for the H520 tumor sections and ME180 tumor sections. Error bars represent the standard deviation.

