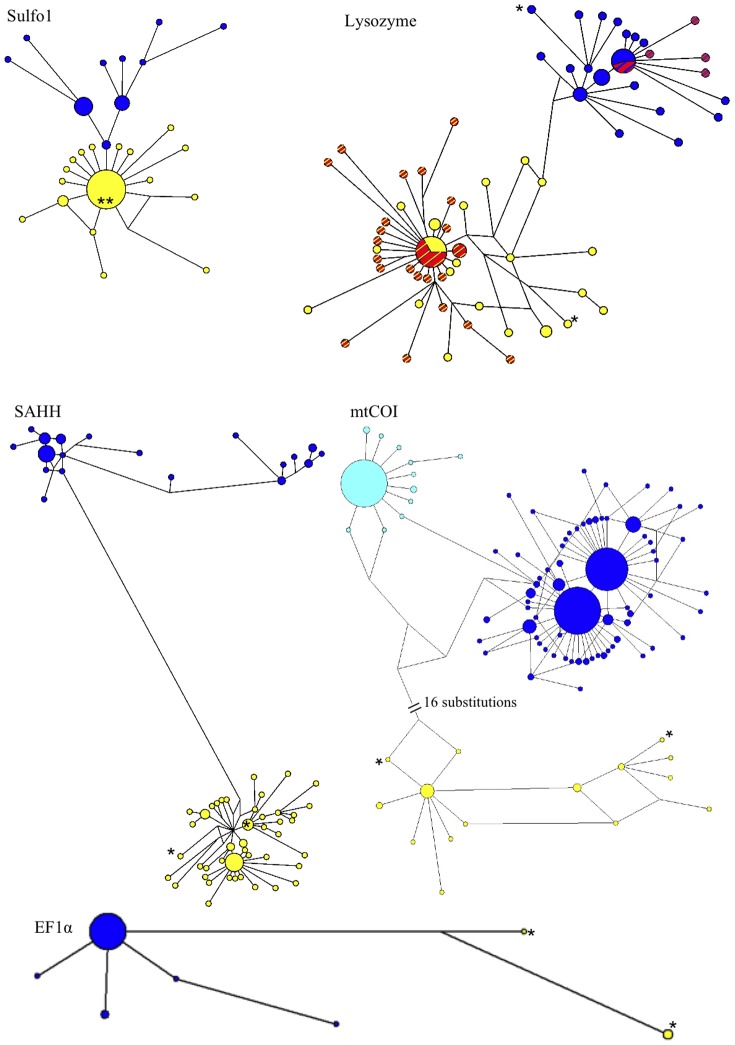
Figure 2. Median Joining Networks on the three nuclear genes and the mitochondrial cytochrome oxidase I gene.
For each gene, the sizes of haplotype/allele circles and lengths of connecting lines are proportional to the number of individuals and the number of mutations that separate two linked haplotypes/alleles, respectively (length is not reflected in the 16-substitution link indicated on the mtCOI network). Colours represent divergent clades used for mapping the geographic distribution of alleles in Figure 3. For the nuclear genes, dark blue circles correspond to clades 1 and yellow circles to clades 2 in the manuscript. For mtCOI, light blue circles = clade 1, dark blue circles = clade 2, yellow circles = clade 3. For the Lysozyme gene, position of the 1-bp deletion in the network is represented by red stripes within both the yellow and the blue circles. *, position of individuals from 38°S in the network. Sulfo 1, Sulfotransferase paralogue 1; Lyso, Lysozyme; SAHH, S-Adenosyl Homocysteine Hydrolase; EF1α, Elongation Factor 1α; mtCOI, cytochrome oxidase I.

