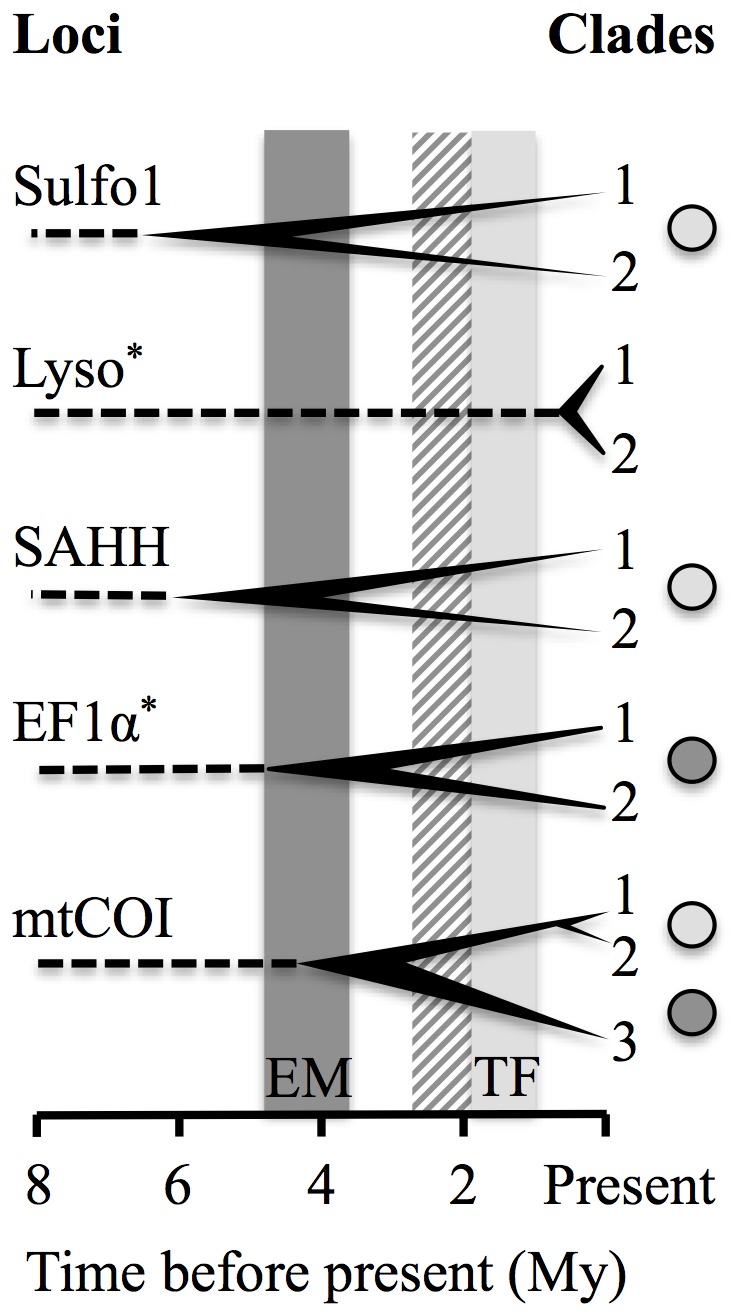
Figure 4. Bifurcated trees showing the correspondence between divergence times between sister clades and times of geological formations.

Clades correspond in those identified in Fig. 2. Grey boxes represent the estimated time of the two barriers: EM, time since the first offsetting of overlapping faults leading to the Easter Microplate (dark grey); TF, time since the formation of Gofar/Discovery transform faults at 7°25′S–14°S latitude (light grey). Striped box represents the estimated time elapsed since the junction between the Pacific Antarctic Ridge and the East Pacific Rise. Grey circles correspond to the geographic position at which the divergence is observed, EM: dark grey and TF: light grey. Dashed lines represent the roots of the trees with the outgroup and calibration point (i.e. Bathymodiolus azoricus, Mid-Atlantic Ridge, about 8–12 Mya). Intervals of estimated divergence, due to the range of the calibration point date, are represented by horizontal thickness of tree nodes. Sulfo1, Sulfotranferase paralogous gene 1; Lyso, Lysozyme; SAHH, S-Adenosyl Homocysteine Hydrolase; mtCOI, mitochondrial cytochrome oxidase 1; EF1α, Elongation Factor 1α. *Lysozyme and EF1α estimates of divergence are indicated but have to be interpreted with caution because these loci did not follow a strict molecular clock.
