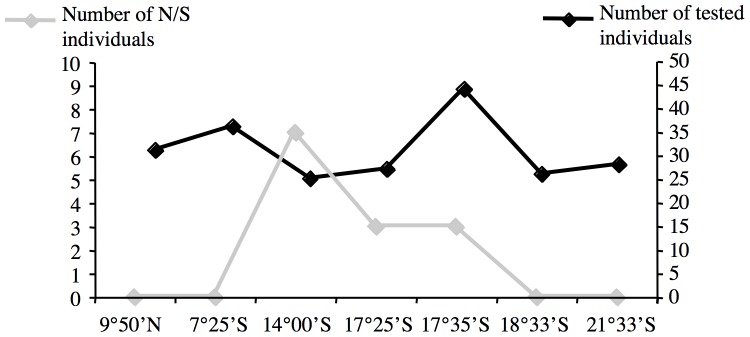
Figure 5. Localisation of individuals with both north and south type alleles in SAHH using RFLP analyses.

N/S individuals, individuals that present one allele from the northern clade (blue clade in Figure 2) and one from the southern clade (yellow clade in Figure 2). Left Y-axis is the number of N/S individuals. Right Y-axis is the total number of individuals.
