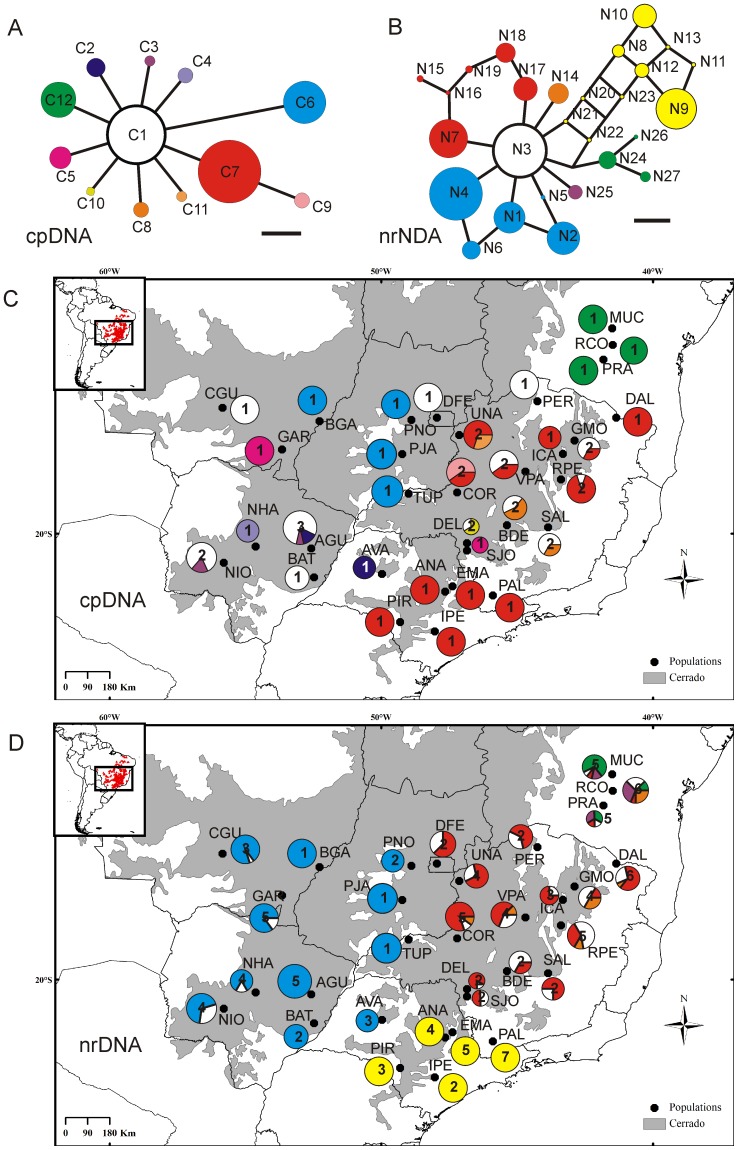
Figure 2. Median-joining networks depicting the relationships among haplotypes of Dalbergia miscolobium based on cpDNA (A) and nrDNA (B) data.
Geographic distribution of the cpDNA (C) and nrDNA (D) haplotypes across sampled populations. Population and haplotype codes correspond to those in Table 1 and Table 2. The network colours are equivalent to those at the maps for the respective genomes. The full circles are proportional to the number of individuals. The numbers inside the circles correspond to number of haplotypes found in that population.

