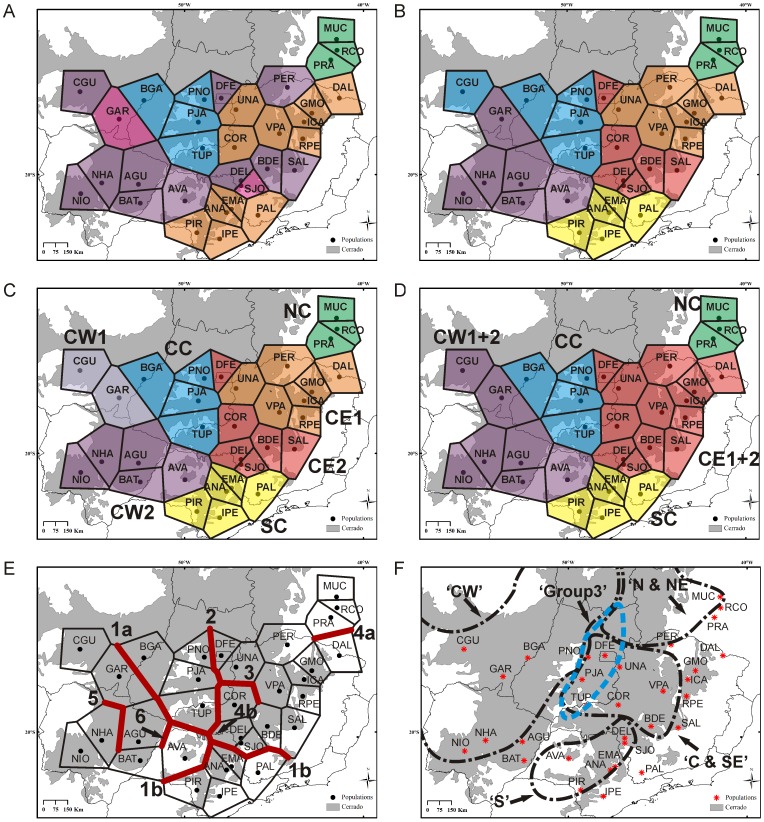
Figure 3. Results from population structure analyses of Dalbegia miscolobium populations (A to E) and the phytogeographical provinces proposed by Ratter et al.
[11] that are superimposed to our sampling area (F). In each panel is represented a result of a different analysis: A) Bayesian Analysis of Population Structure (BAPS) with cpDNA only; B) BAPS with nrDNA only; C) BAPS with cpDNA and nrDNA concatenated; D) BAPS with cpDNA and nrDNA concatenated with a prior of k = 5; E) Analysis with the Monmonier's algorithm implemented in Barrier 2.2. In panels A to E, the polygons are the result of Voronoi tessellation and each one is correspondent to a population whose code is the same as in Table 1. Polygons with the same color belong to the same BAPS cluster. In panel E, the red lines correspond to the consensus barriers among the cpDNA and nrDNA distance matrices. The barriers are numbered in order of their appearance which is related to their probability of existence. The larger abbreviations in panels C and D are for the phylogeographic groups as detailed in Results and Table 2. In panel F, the black traces are for the phytogeographical provinces of Ratter et al. [11] and the blue trace is correspondent to Group 3 from their Twinspan analysis. The codes of the provinces are the same of the original publication. For names of provinces see Figure 1 and for further details about them, refer to the text.

