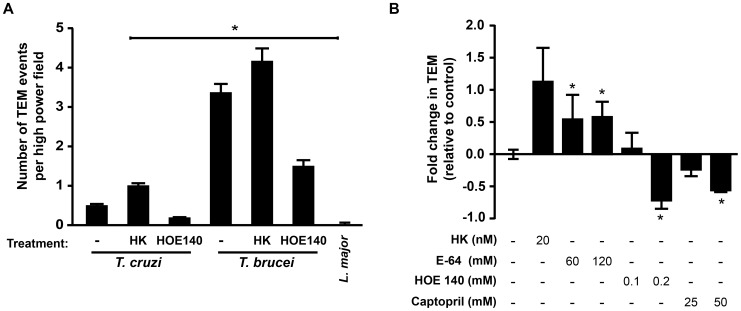
Figure 6. Comparative TEM among the Kinetoplastidae.
(A) TEM was assayed for T. cruzi, T. brucei, and Leishmania major using our standard TEM method with 1×10⁵ parasites/well. Parasites were prepared as described in the Methods. Where indicated, samples were treated (both during a 30 minute pre-incubation and during infection/TEM) with HK or HOE 140 at 20 ng/mL and 200 nM, respectively. Data shown represent the total TEM events per high power field to highlight the large differences observed with T. brucei and L. major. Data were collected from three independent experiments with 2–3 replicates per sample per experiment. * denotes significant difference relative to T. cruzi non-treated controls, p <0.05. (B) To confirm that T. brucei TEM was responsive to manipulations of the bradykinin signaling pathway, we treated samples with the indicated reagents (both pre-incubation and during TEM) and assayed TEM using the standard assay. To correct for variations between parasite preparations and aid in visualization, data are shown as the fold change relative to control (no treatment). * denotes p<0.05 relative to the control.

