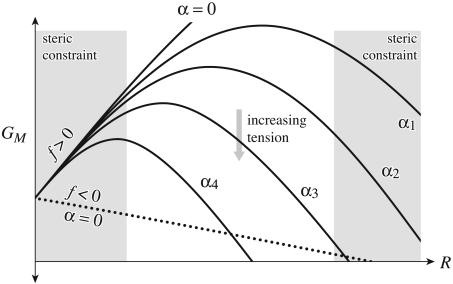
Fig. 2.
The bilayer deformation energy landscape. The bilayer deformation energy is plotted as a function of the radius for different values of applied tension. The solid curves represent the bilayer deformation energy with a positive line tension, f, for various different tensions (0 < α1 < α2 < α3 < α4). The competition between interface energy and applied tension naturally gives rise to a bistable potential when the radial domain is limited by steric constraints. The gray regions represent radii inaccessible to the channel because of steric constraints. These constraints are briefly motivated in The Energy Landscape of the Bilayer. If the line tension is negative, depicted by the dotted curve, the potential is never bistable.

