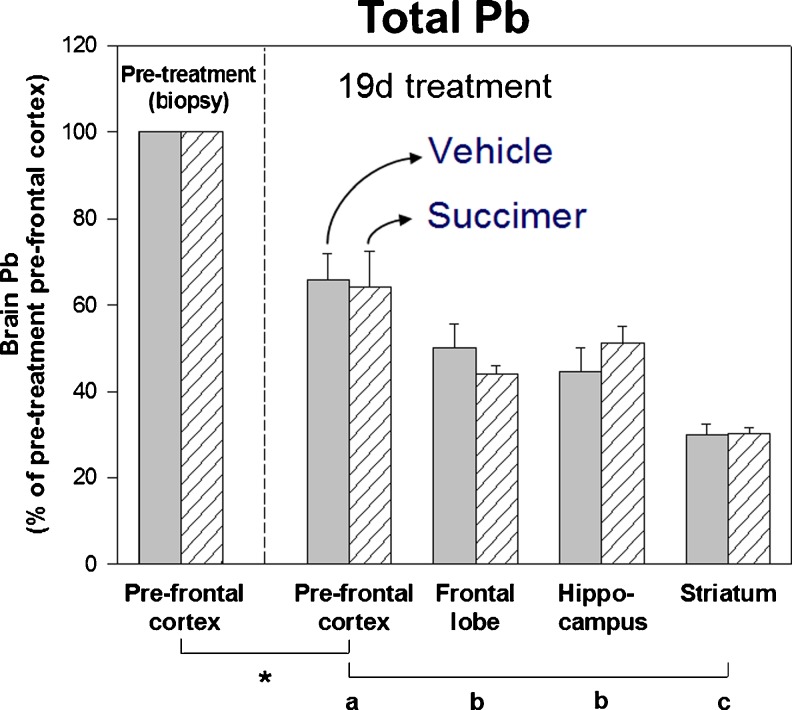
Fig. 10.
Lead levels in brain prefrontal cortex (PFC, pre- and post-treatment), frontal lobe, hippocampus, and striatum of the vehicle- (solid bars, n = 5) and succimer- (hatched bars, n = 6) treated groups (lead levels expressed as a percentage of the pretreatment PFC level within each animal). Values are means (±SE). Mean values of lead concentrations in the pretreatment PFC biopsy for the vehicle- and succimer-treated groups were 1,980 and 1,410 ng/g dry wt., respectively. Symbols below the x-axis indicate: * = pre- and post-treatment mean values were significantly different; a, b, and c comparisons of post-treatment brain regions. Means with different letters were significantly different from one another. Data from Cremin et al. [13]. [Reprinted from Toxicology and Applied Pharmacology with permission from Elsevier]

