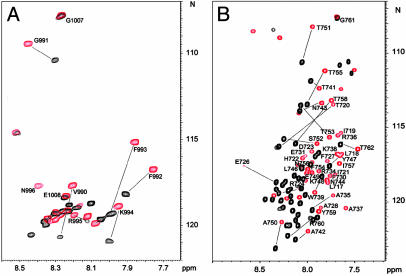
Fig. 2.
Spectral perturbation for αIIb/DPC and β3/DPC interactions. (A) Heteronuclear single quantum correlation (HSQC) spectra of 15N-labeled αIIb in the absence (black) and presence (red) of 300 mM DPC showing dramatic perturbation in the membrane-proximal region K989-R997. (B) HSQC spectra of 15N-labeled β3 in the absence (black) and presence (red) of 300 mM DPC. A global spectral perturbation occurs indicating a complex structural rearrangement as compared to αIIb in A.

