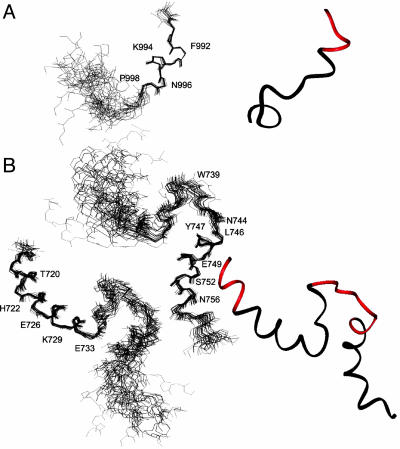
Fig. 4.
Structures of αIIb and β3 cytoplasmic tails in DPC. (A) Backbone superposition of the 20 best structures and ribbon diagram of the αIIb tail. The membrane-anchoring site is highlighted in the ribbon diagram (red). (B) The 20 best structures of β3 superimposed on either N-terminal helix K716-R734 or C-terminal N744-T755. The relative orientation between the two helices is less defined due to the lack of interhelical NOEs. The membrane-anchoring sites for both tails are highlighted in the ribbon diagram (red).

