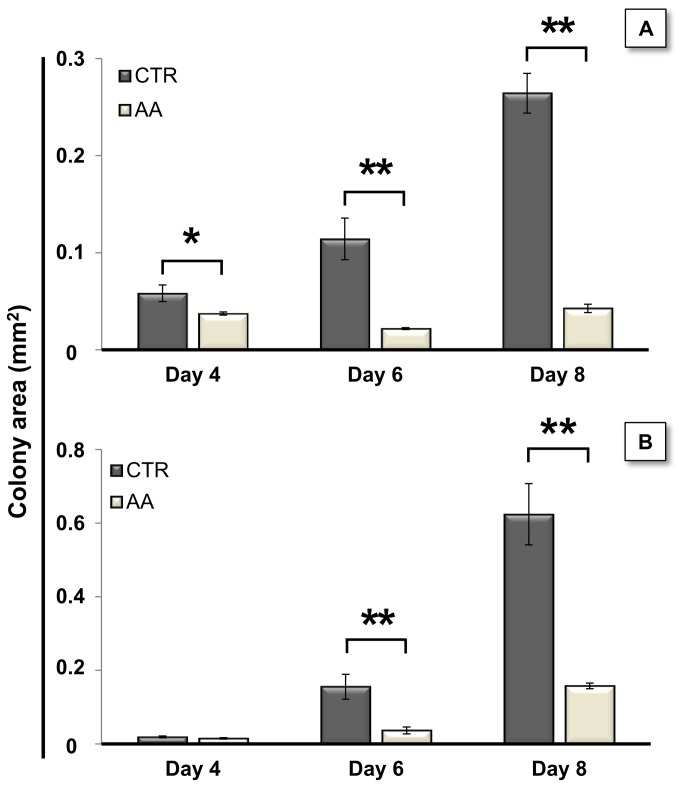
Figure 5. AA reduces colony area.
Antimycin A treatments were initiated at day 2 of differentiation using both R1 (A) and E14 cells (B), and repeated every one and half days. Cells were fixed at days 4, 6 and 8 and colony areas were evaluated by processing phase-contrast microscopy photographs with Image J. For both cell lines AA treatment severely decreased the colony area. To verify parametric assumptions by Shapiro-Wilk and Levene tests, area values were submitted to a logarithm transformation. Data were then evaluated by a two-way Anova for independent samples, which revealed a significant interaction between the effects of treatment and time. Subsequent simple main effects analysis showed that the areas from treated and control colonies were significantly different at days 4 (P= 0.03), 6 (P= 0.000001) and 8 (P= 0.000002) for R1 cells and at days 6 (P= 0.0001) and 8 (P= 0.0002) for E14 cells. Error bars = SEM (* p<0.05; ** p<0.01). For better comprehension raw area values from 3 independent experiments are represented.

