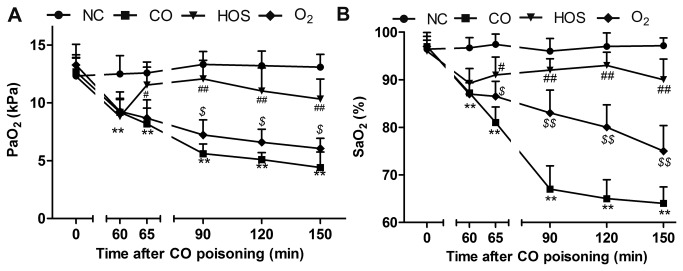
Figure 2. Changes in arterial oxygen partial pressure (PaO2) and arterial oxygen saturation (SaO2).
The mean PaO2 levels at 0, 60, 65, 90, 120, and 150 min after acute CO poisoning (A). The mean SaO2 level at 0, 60, 65, 90, 120, and 150 min after acute CO poisoning (B). The values are means ± SDs (n = 8).* comparison of the PaO2 or SaO2 values of the CO group with those of the NC group (** indicates P < 0.01). # comparison of the PaO2 or SaO2 values of the HOS group with those of the O2 group (# and ## indicate P < 0.05 and P < 0.01, respectively). $ comparison of the PaO2 or SaO2 values of the O2 group with those of the CO group ($ and $$ indicate P < 0.05 and P < 0.01, respectively).

