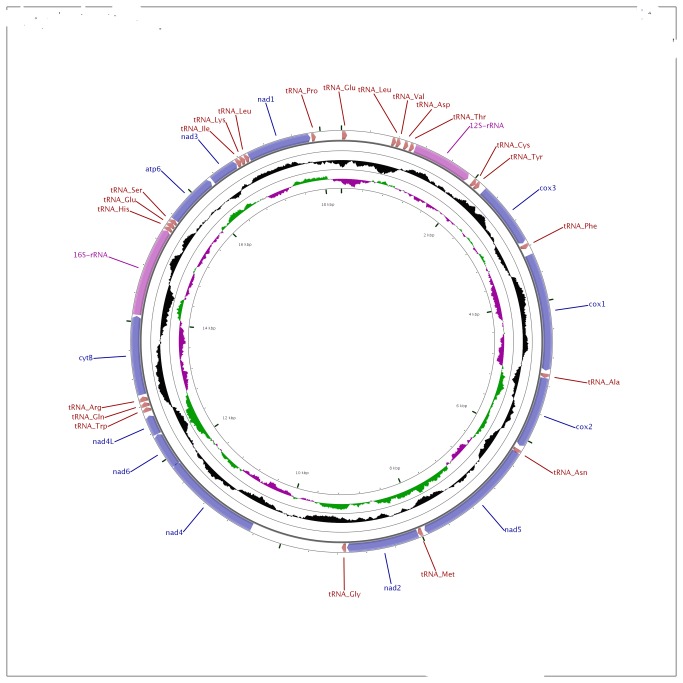
Figure 1. Map of the mitochondrial genome of A. islandica.
The image was prepared using the CGView Server at http://stothard.afns.ualberta.ca/cgi-bin/cgview_server/. The Outer circle shows the genes, the middle circle the GC content and the inner circle the GC skew.

