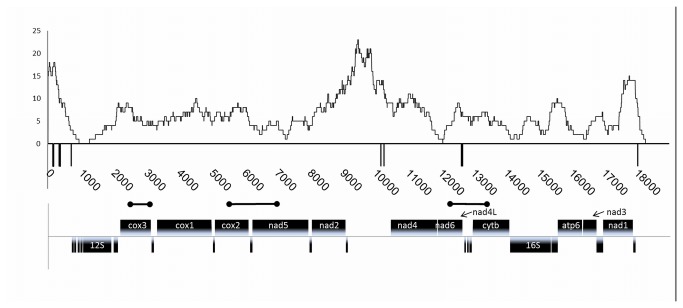
Figure 3. Polymorphisms in the mitochondrial genome.
Single nucleotide polymorphisms (SNPs) were counted in a sliding window of 500 with a step size of 1. All genes are depicted below the SNP frequency curve. The indel regions are indicated by vertical lines below the sliding window curve. Protein coding genes (CDS) are shown above the second line and RNA species below that same line as boxes. The CDS and the 12S and 16S RNA genes are named, while the tRNA genes are only depicted as rectangles. The bar-bell shapes indicate the amplified regions from 17 specimen.

