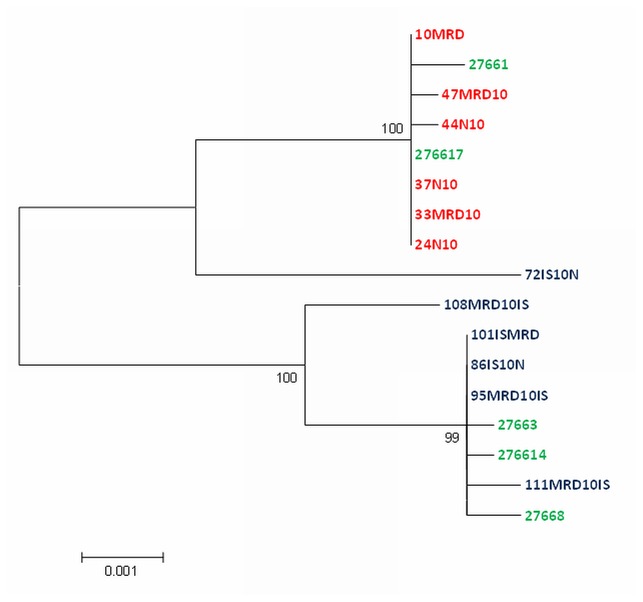
Figure 4. Molecular Phylogenetic analysis of the concatenated nucleotide sequences from three regions of the mitochondrial genome (2470 to 3050; 5490 to 6890; 12230 to 13380) using the Maximum Likelihood method based on the Hasegawa-Kishino-Yano model [40].
Initial tree(s) for the heuristic search were obtained automatically by applying Neighbor-Join and BioNJ algorithms to a matrix of pairwise distances estimated using the Maximum Composite Likelihood (MCL) approach, and then selecting the topology with superior log likelihood value. The tree is drawn to scale, with branch lengths measured in the number of substitutions per site. Evolutionary analyses were conducted in MEGA5 [38]. Blue: Iceland; Green: Baltic Sea; Red: North Sea.

