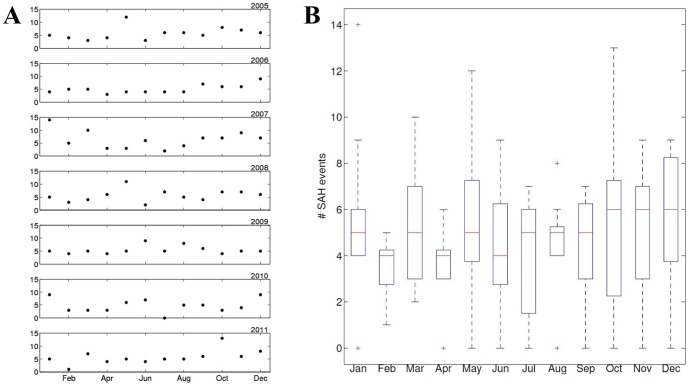
Figure 6. Seasonal distribution of SAH events.
The seasonal distribution of SAH events between 2005 and 2011 (whole-year data sets) is depicted for individual years (A) and for the entire studied time period (B). While there are monthly peaks in individual years (A), no obvious peak can be identified when analyzing the entire studied time period (B).

