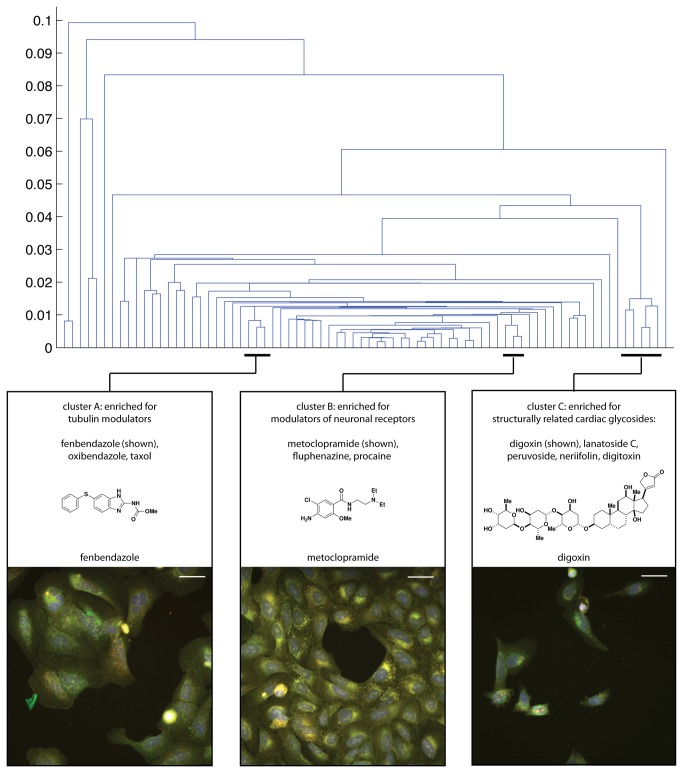
Figure 2. Hierarchical clustering of image-based profiles.
Details are shown for three of the clusters that were highly enriched for annotation terms. These enriched clusters contain compounds with similar mechanisms of action, some with similar and some with distinct chemical structure. The presence of these enriched clusters indicates that the assay can identify subtle, physiologically relevant effects of compounds on cultured cells. U2OS cells labeled for nuclei (blue), ER (green), nucleoli (grey), actin and Golgi (yellow), and mitochondria (red). Scale bars 50 µm.

