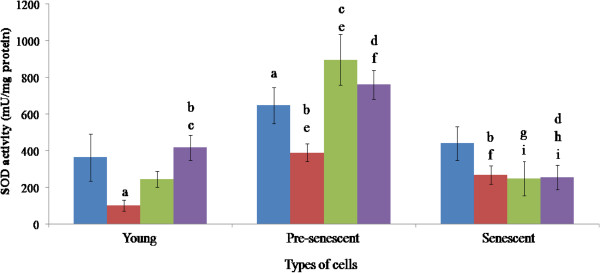
Figure 4.
SOD activities of HDFs treated with P. betle, C. vulgaris and TRF. Blue, red, green and violet bars represent control, P. betle, C. vulgaris, and TRF treatments, respectively. ap < 0.05 compared to young HDFs, bp < 0.05 compared to P. betle-treated young HDFs, cp < 0.05 compared to C. vulgaris-treated young HDFs, dp < 0.05 compared to TRF-treated young HDFs, ep < 0.05 compared to pre-senescent HDFs, fp < 0.05 compared to P. betle-treated pre-senescent HDFs, gp < 0.05 compared to C. vulgaris-treated pre-senescent HDFs, hp < 0.05 compared to TRF-treated pre-senescent HDFs, ip < 0.05 compared to senescent HDFs. Data are presented as mean ± SEM, n = 6.

