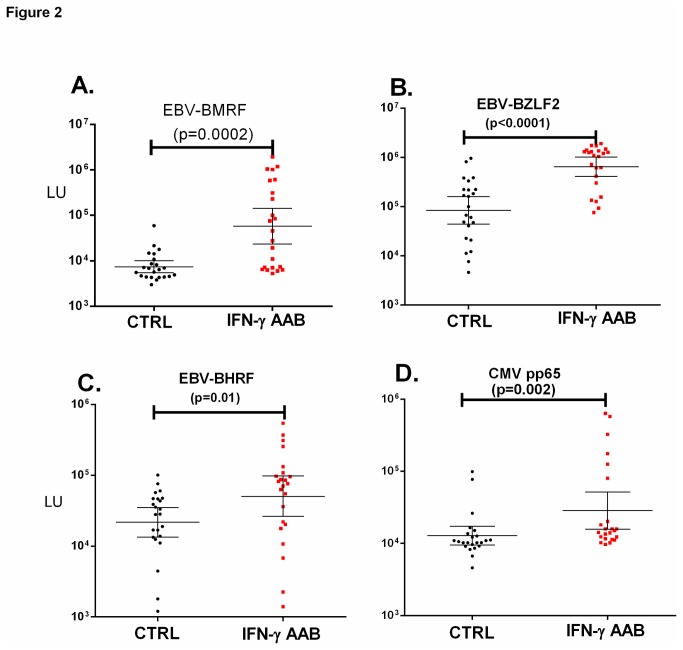
Figure 2. Validation of increased anti-EBV and anti-CMV antibodies in IFN-γ AAB patients.
The antibody responses for (A) EBV BMRF (B) EBV BZLF2 (C) EBV BHRF and (D) CMV pp65 in the 23 controls (black) and 23 IFN-γ AAB patients (red) are plotted on the Y-axis using a log10 scale. Each symbol represents one individual. The geometric mean level and 95% CI for antibody levels are also shown. P values comparing the two groups were calculated using the Mann-Whitney U test.

