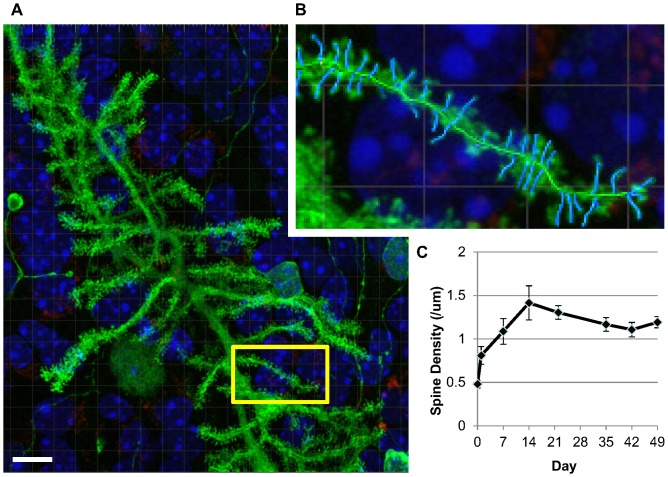
Figure 2. Purkinje cell spine density analysis; stability in uninfected cerebellar slice cultures from C57Bl6 mice.
A,B) Representative Z-stacked image of a Purkinje cell as analyzed with Imaris 7.1.1 software, after deconvolution with ImageQuant X. B) Inset of A showing dendritic spine analysis; spines identified in blue. Nuclei are stained with Hoechst (blue), dead cells are stained with propidium iodide (red) and Purkinje cells are labelled with calbindin/Alexafluor488 (green). Scale bar 10 µm. C) Average spine density from uninfected cerebellar cultures from C57Bl6 mice at weekly time points. Errors bars represent one standard error of the mean. n = 9 except day 14 where n = 3.

