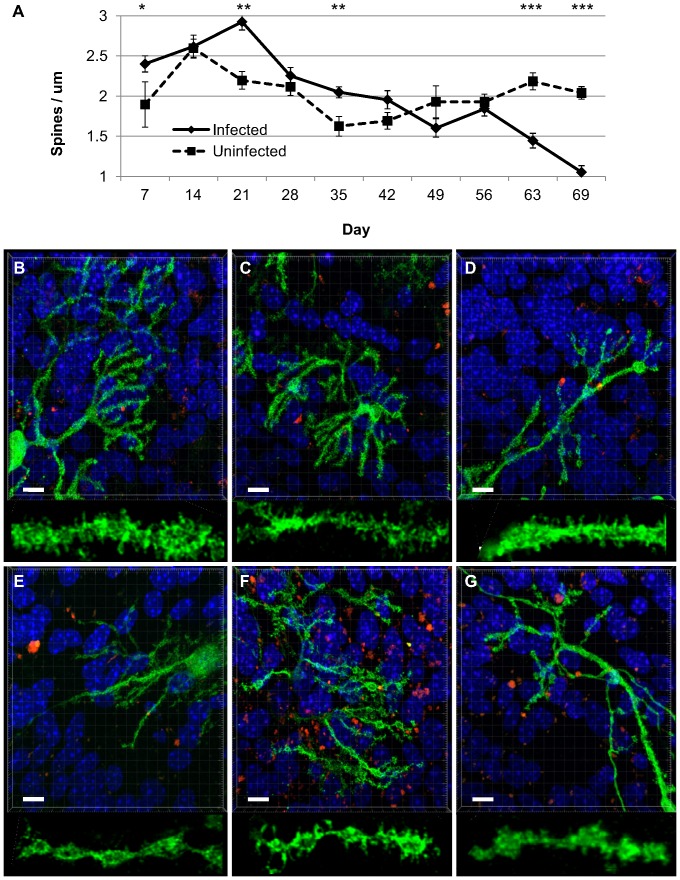
Figure 4. Purkinje cell dendritic spine densities in RML-infected and uninfected cerebellar slice cultures.
A) Average Purkinje cell spine densities at weekly time points. B–G) Representative images from uninfected (B–D) and RML-infected (E–G) cultures at day 69. Nuclei are stained with Hoechst (blue), dead cells are stained with propidium iodide (red) and Purkinje cells are labelled with Calbindin/Alexafluor488 (green). Scale bar 10 µm. Insets below each panel are magnified by a factor of three to better visualize dendritic spines. Images of fixed samples were taken on a Zeiss LSM 700, 63x oil objective, deconvolved with ImageQuant X and analyzed using Imaris 7.1.1 software. The average n was 23 per time point for infected (range 12–41), 14 for uninfected (range 6–22). At day 69, n = 17 for infected, n = 21 for uninfected. p-values: * <0.05; ** <0.01; *** <0.001.

